Dashboard Guide
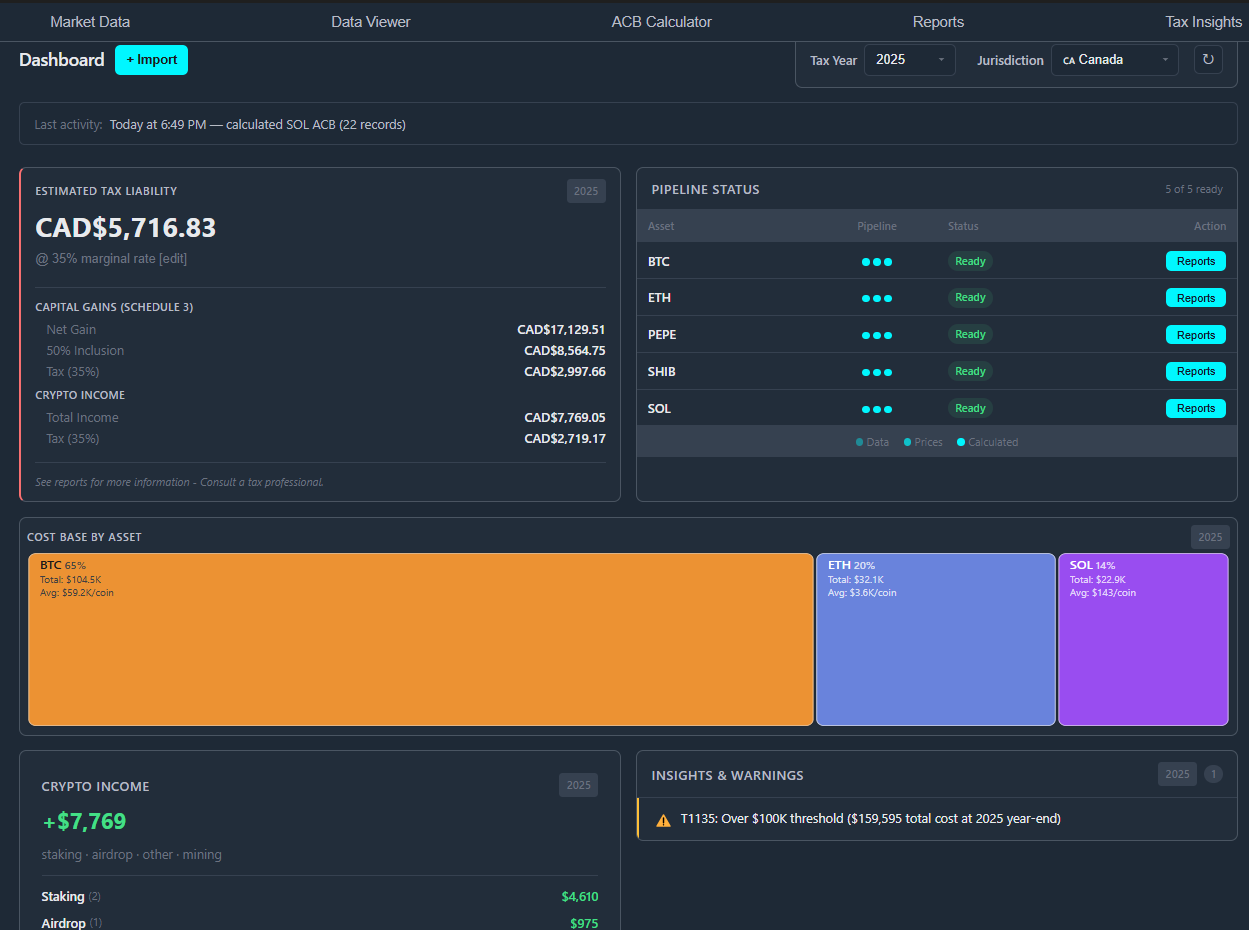
Welcome to the PrivateACB Dashboard. This is your command center for crypto taxes — every number you need to file, every status indicator that tells you whether the numbers are trustworthy, and the visual that ties it all together.
The dashboard reads from your existing data; it doesn’t run calculations or fetch market data on its own. If something looks wrong, the fix lives in the relevant tab (ACB Calculator, Market Data, Import wizard) — the Dashboard is where you discover that something needs attention, then click through.
Dashboard Controls
Section titled “Dashboard Controls”Use the controls at the top to configure the view. All cards update instantly when you change these settings.
| Control | Purpose |
|---|---|
| Tax Year | The year to analyze. Display format depends on jurisdiction: CA/US use calendar year (“2025”); AU uses fiscal year (“2024-25” = Jul 1, 2024 to Jun 30, 2025); UK uses tax year (“2025/26” = Apr 6, 2025 to Apr 5, 2026). |
| Jurisdiction | Canada (CA), United States (US), Australia (AU), or United Kingdom (UK) — limited to those licensed in your installation. |
| Method | CA/UK use ACB / Section 104 pooling exclusively. US/AU offer FIFO, LIFO, or HIFO. The dropdown disables itself for CA/UK. |
| Refresh | Re-reads cached calculations from disk. Use after a long calculation completes or when switching databases. |
A Last activity strip shows below the controls indicating the most recent import, calculation, or market-data fetch and when it happened.
A Readiness strip below that indicates whether your data is in shape for a meaningful tax view. If the strip says you’re not ready, the dashboard cards still render but values may be incomplete — fix the readiness gap (almost always missing prices or stale calculations) before trusting any number.
Dashboard Layout
Section titled “Dashboard Layout”The dashboard uses a vertical bento layout. From top to bottom:
- Tax Summary card — your headline numbers and the Estimated Tax Liability dropdowns
- Tax-Year Bridge — the broken-axis visualization tying cost basis, realized activity, and tax together
- Insights & Warnings — actionable signals derived from your actual data
- Pipeline Status — per-asset readiness for calculation
- Detail Tables — collapsible deep-dive into Import History, Calculation Status, Market Data Status
When you first open a database with no transactions, you’ll see an empty state with a prompt to import. Once you have data, the full layout populates.
1. Tax Summary Card
Section titled “1. Tax Summary Card”The hero card. Combines your jurisdiction’s capital-gains math, your estimated tax liability with editable rate dropdowns, your crypto income, and any insight chips that fired this tax year.
Capital Gains Panel
Section titled “Capital Gains Panel”The panel adapts to the jurisdiction.
Canada (CA):
| Field | Meaning |
|---|---|
| Net Proceeds | Total proceeds from crypto dispositions, in CAD |
| Adjusted Cost Base | Total cost base of disposed assets, in CAD |
| Capital Gains | Net proceeds minus cost base |
| Taxable (50%) | Half of capital gains (Canada’s 50% inclusion rate) |
| Superficial Losses Denied | Losses denied under CRA’s 30-day superficial loss rule |
United States (US):
The card shows your Schedule D capital-gains breakdown for the chosen method (FIFO / LIFO / HIFO). Short-term and long-term gains appear on separate lines. Wash-sale adjustments (IRS §1091) appear when present.
Australia (AU):
The card shows the ATO Q18 netting breakdown:
| Field | Meaning |
|---|---|
| Total Gains | Sum of all gains, split into discount-eligible and non-discount |
| Capital Losses | Total losses to offset |
| CGT Discount | The 50% discount applied to eligible discount gains |
| Net Capital Gain | After discount |
United Kingdom (UK):
The card shows the Section 104 pool result, AEA (Annual Exempt Amount) consumption, and the post-AEA taxable gain.
| Field | Meaning |
|---|---|
| Total Net Gains | Net of Section 104, same-day, and 30-day matched disposals |
| Annual Exempt Amount | £3,000 from 2024/25 onwards |
| Taxable Gain | Net gains minus AEA (floors at zero) |
Estimated Tax Liability
Section titled “Estimated Tax Liability”Below the capital-gains breakdown, the card estimates your tax liability using a configurable rate. The dropdown controls differ by jurisdiction:
- CA / AU: Marginal Rate — click to edit; PrivateACB remembers it for next time.
- US: Long-term rate dropdown with options 0%, 15%, 20% (matching IRS LTCG brackets). Stored per-database in your preferences. Short-term gains are always taxed at the ordinary rate (the Marginal Rate above).
- UK: Income tax rate dropdown with options 20%, 40%, 45% (matching HMRC bands). Used to estimate tax on staking, mining, and airdrop income — not on capital gains, which use the separate CGT rate slider.
Crypto Income Section
Section titled “Crypto Income Section”Embedded inside the same card, below the capital-gains panel, the Crypto Income section sums every income-class transaction in the tax year:
| Income Type | Examples |
|---|---|
| Staking | Proof-of-stake rewards |
| Mining | Mining rewards (PoW) |
| Airdrop | Token airdrops, fork credits |
| Reward | Exchange rewards, referral bonuses, learn-and-earn |
| Interest | DeFi lending interest |
| Other | Custom income types defined during Classification Review |
Income is taxed at the full ordinary rate (the Marginal Rate or, for UK, the Income tax rate selected above) — there’s no 50% inclusion as for capital gains in CA/AU.
Method-Aware Aggregates (US / AU)
Section titled “Method-Aware Aggregates (US / AU)”If you’ve run multiple methods (e.g., FIFO and LIFO and HIFO), the Tax Summary card uses the currently selected method for all aggregates — gains, losses, wash-sale or CGT-discount counts, and the estimated tax liability. Switch methods in the Dashboard Controls to flip the entire view.
2. Tax-Year Bridge
Section titled “2. Tax-Year Bridge”The Tax-Year Bridge is the dashboard’s signature visual — a single horizontal bar that reads left to right and ties cost basis, this tax year’s realized activity, and your estimated tax together in one shape.
The bar has four layers:
- Coloured segments on the left — each asset’s share of your year-end cost basis. Mouse over any segment for symbol and dollar value.
- Red cost-end line — a vertical line marking where cost basis ends and this tax year’s realized activity begins. Acts as the spatial boundary between the two zones.
- Green zone on the right of the red line — realized gains plus crypto income for this tax year. Turns red when your net realized result is a loss.
- Red hatched fill at the right edge of the green zone — the estimated tax on the realized amount, using the rate dropdowns from the Tax Summary card above.
Two display modes
Section titled “Two display modes”When this year’s realized activity is large enough relative to your cost basis, the bar uses one shared scale across the whole width — proportions are honest end-to-end.
When realized activity is structurally tiny compared to cost basis (most years for a long-term holder with few sales), the realized zone is forced to a minimum width so the labels stay readable. In this mode the red line acts as a visible scale break between two independent scales — one for the cost zone, one for the realized zone. Within each zone, proportions remain honest. Across the line, they’re intentionally not — a small realized total isn’t dwarfed into invisibility.
Mirror logic exists for the rare case of a high-realized year with very small accumulated cost basis.
T1135 tripwire (CA only)
Section titled “T1135 tripwire (CA only)”For Canadian users, a dashed vertical tripwire line appears at the CAD $100,000 threshold in the cost zone. If your year-end cost basis crosses the line, you’re at or above the T1135 Foreign Income Verification filing threshold for any holdings that qualify as foreign property. The tripwire is informational — it doesn’t assert that T1135 applies (custodian location matters; see the T1135 insight below) but it’s a fast visual pre-check.
In-card explainer
Section titled “In-card explainer”The small ⓘ button at the top-left of the Tax-Year Bridge zone toggles a jurisdiction-aware explainer panel describing what each visual element means in the language of your jurisdiction’s tax forms. Open it once to learn the grammar; it doesn’t persist between sessions.
3. Insights & Warnings
Section titled “3. Insights & Warnings”The Insights & Warnings panel surfaces actionable signals derived from your actual data — never generic advice. Each signal carries a severity (warning, info, success) and most have an action button that takes you directly to the fix.
Insight types
Section titled “Insight types”T1135 Foreign Property Warning (Canada)
“Cost basis is $X. T1135 may apply if any holdings are custodied outside Canada.”
If your year-end cost basis exceeds the $100,000 CAD threshold AND any holdings qualify as foreign property (held on a foreign exchange or in a foreign wallet), Form T1135 applies. PrivateACB can’t determine custodian location automatically, so the insight is an honest “this might apply, review with your tax professional” nudge rather than an assertion.
Superficial Loss Warning (Canada)
“X assets have superficial losses totaling $Y CAD.”
The 30-day superficial loss rule denied $Y of losses across X assets this year. Click through to the Superficial Loss Report for the per-disposal breakdown.
Wash Sale Warning (US)
“X wash sales detected totaling $Y in disallowed losses.”
Losses disallowed under IRS §1091. See the Wash Sale Guide for treatment details.
CGT Discount Used (Australia)
“50% CGT discount applied to $X of eligible long-term gains.”
The CGT discount fired on assets held longer than 12 calendar months. The discount is automatic when eligibility is met; the insight tells you how much the discount saved this year.
AEA Usage (United Kingdom)
“AEA fully consumed — £X in net gains exceeds £3,000 annual threshold.” “AEA partly used — £Y of £3,000 used; £Z remaining.”
Surfaces how much of your Annual Exempt Amount you’ve used this year. Useful for end-of-year disposal planning if you have flexibility around the AEA boundary.
Missing Prices Warning
“X assets missing price data for Y transactions.”
Fetch market prices before finalizing your calculations. See the Market Data Guide.
Stale Calculations Warning
“X assets have new transactions since last calculation.”
You’ve imported new data — re-run the calculator to refresh.
Zero Cost Basis (all jurisdictions)
“X transactions have zero cost basis.”
Some acquisitions came in without a purchase price — usually fork credits, airdrops, or external transfers. See the Preflight Errors Guide for how to add cost basis or reclassify the rows.
Taking action
Section titled “Taking action”Most insights include a button — View Report, Recalculate, Fetch Prices, Open Calculator — that takes you exactly where the fix lives. Insights without a button are informational and don’t require any action.
4. Pipeline Status
Section titled “4. Pipeline Status”Never wonder if your calculations are up to date. The Pipeline Status card tracks calculation readiness for each asset across three stages.
Status indicators
Section titled “Status indicators”Each asset row shows three pipeline stages:
| Stage | Icon | Meaning |
|---|---|---|
| Data | ○ / ● | Transaction data imported |
| Prices | ○ / ● | Market prices available for all transactions |
| Calculated | ○ / ● | ACB / cost-basis calculations complete and current |
A filled circle (●) means complete; an empty circle (○) means action needed.
Pipeline summary
Section titled “Pipeline summary”The card header shows overall progress: “X of Y Ready” counts how many assets have all three stages complete.
”Last Calculated” semantics
Section titled “”Last Calculated” semantics”For assets with transactions in the selected tax year, the Last Calculated column shows when the most recent calculation ran (or “STALE” if you’ve imported data since). For assets with zero transactions in the selected tax year — held but not transacted — the column shows an em-dash (—) rather than “Needs Calculation.” There’s nothing to calculate when there’s no activity.
YTD scope
Section titled “YTD scope”The pipeline column showing per-asset year-to-date activity is scoped to the selected tax year in the Dashboard Controls. Switching tax years changes which assets show activity and which show the em-dash.
Smart actions
Section titled “Smart actions”Click any incomplete stage to jump directly to the fix:
- Missing Data → opens the Import wizard
- Missing Prices → opens the Market Data tab with the affected dates pre-selected
- Missing Calculated → opens the ACB Calculator with the affected asset queued
If preflight blocks the calculation, unfold the asset’s row — click the chevron (▶) or the Preflight Check label — to read the Preflight Report. See the Preflight Errors Guide for the full troubleshooting walkthrough, and Transfer Assertions for deposits with no matching withdrawal.
5. Detail Tables
Section titled “5. Detail Tables”Below the main cards, three collapsible tables expose deeper detail for power users. Collapsed by default to keep the dashboard clean.
Import History
Section titled “Import History”Every import job with date, source, record count, and status. Useful for verifying that all your exchange data has been loaded and that no import job silently failed.
Calculation Status
Section titled “Calculation Status”The most recent calculation for each asset — when it ran, which method was used, and whether the result is current or stale relative to your imports.
Market Data Status
Section titled “Market Data Status”Which assets have complete market data (exchange rates and crypto prices) and which have gaps that still need attention.
These tables are read-only — they’re for inspection and verification. Data changes happen in their respective tabs (Import wizard, Market Data, ACB Calculator).
Best Practices
Section titled “Best Practices”- Address the Readiness Strip first. If the strip says you’re not ready, the dashboard cards may render incomplete or stale numbers. Fix the readiness gap before relying on any figure.
- Address Insights warnings before generating reports. Reports inherit the same data the dashboard reads from — a warning on the dashboard becomes a problem on the PDF.
- Pipeline before tax estimates. All three circles filled before reading the Tax Summary card means the numbers you see are computed from complete data.
- Use the Tax-Year Bridge as a sanity check. A long-term holder’s bar should be mostly cost zone with a thin realized zone — if your bar looks dramatically different from what you expect, investigate.
- Switch tax years to spot trends. Cost basis grows over time; realized activity comes and goes per year. Year-on-year comparison surfaces both data-completeness gaps and tax-planning opportunities.
- Switch methods (US/AU) to compare. With method-aware aggregates, switching FIFO ↔ LIFO ↔ HIFO in the Dashboard Controls flips the entire view to show that method’s outcome. Useful for what-if analysis before exporting reports.
Related Guides
Section titled “Related Guides”- Canadian Tax Reports — Schedule 3, T1135, Superficial Loss
- US Tax Reports — Form 8949, Schedule D, Wash Sale
- Australian Tax Reports — CGT Summary, CGT Worksheet
- UK Tax Reports — SA108 Summary, Capital Gains Detail, Pool History
- Market Data — Fetching and managing prices and exchange rates
- Preflight Errors — Resolving issues that block calculations
- Performance Metrics — Understanding calculation speed grades
Last Updated: July 2026 PrivateACB Version: 2.12.0