Dashboard Guide
Welcome to the PrivateACB Dashboard! This is your command center for crypto taxes — giving you a complete picture of your tax situation at a glance.
Dashboard Controls
Section titled “Dashboard Controls”Use the controls at the top to configure your view:
| Control | Purpose |
|---|---|
| Tax Year | Select the tax year to analyze (e.g., 2024, 2025) |
| Jurisdiction | Choose Canada (CA), United States (US), Australia (AU), or United Kingdom (UK) |
| Method | CA/UK: ACB only. US/AU: FIFO, LIFO, or HIFO |
All dashboard cards update instantly when you change these settings.
Dashboard Layout
Section titled “Dashboard Layout”The dashboard is organized into a bento grid layout with several cards. When you first open a database with no data, you’ll see an empty state with a prompt to import transactions. Once you have data, the full dashboard populates automatically.
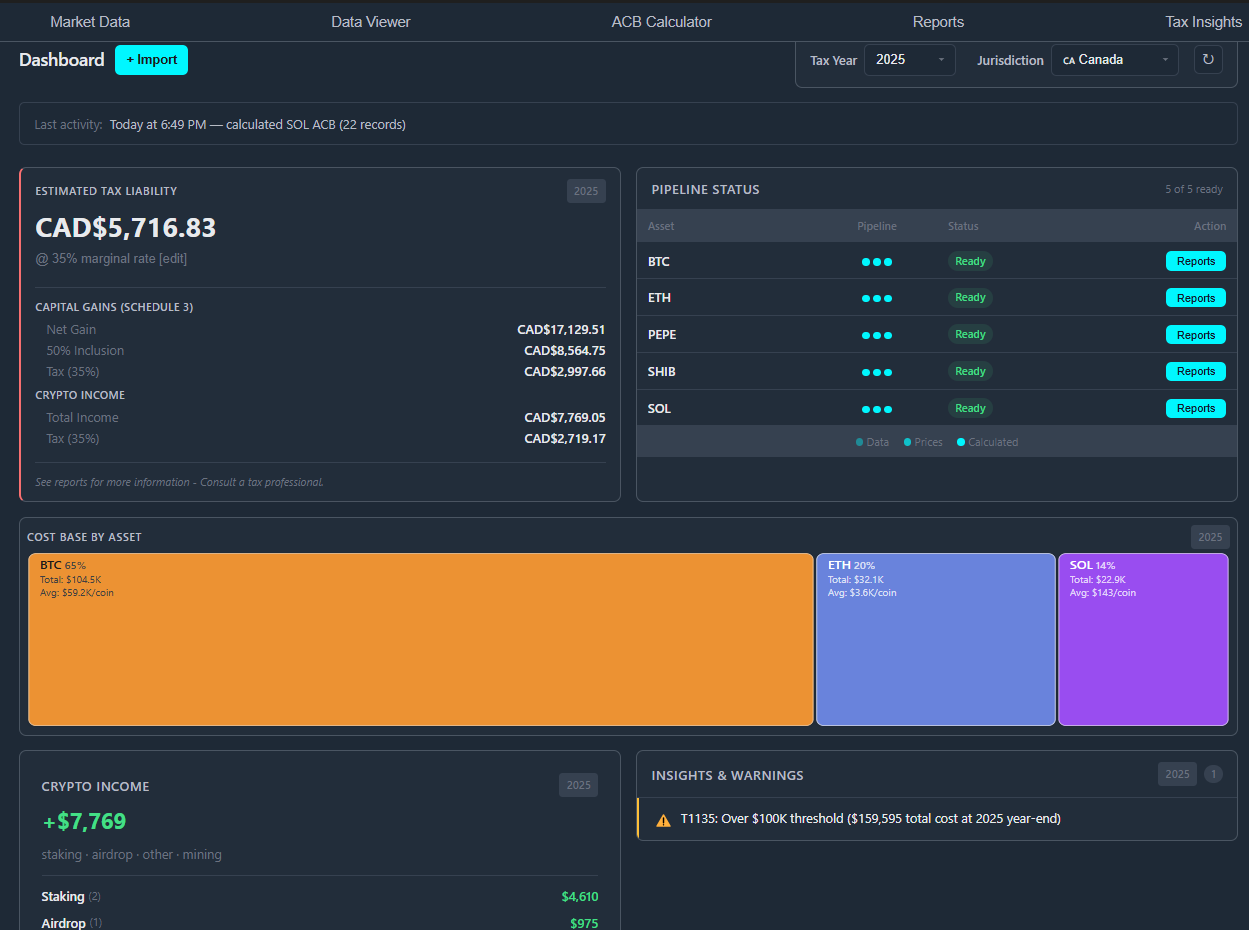
1. Hero Metrics: Capital Gains & Crypto Income
Section titled “1. Hero Metrics: Capital Gains & Crypto Income”The top row shows your two most important numbers at a glance.
Net Capital Gain/Loss Card
Section titled “Net Capital Gain/Loss Card”Your net capital gain or loss for the selected tax year and jurisdiction.
For Canadian users:
| Field | Meaning |
|---|---|
| Net Proceeds | Total proceeds from crypto dispositions |
| Adjusted Cost Base | Total cost base of disposed assets |
| Capital Gains | Net proceeds minus cost base |
| Taxable (50%) | Half of capital gains (Canada’s 50% inclusion rate) |
| Superficial Losses | Losses denied under CRA’s superficial loss rule |
For US users: This section shows Schedule D capital gains with your chosen method (FIFO/LIFO/HIFO) and any wash sale adjustments. Short-term and long-term gains are broken out separately.
For Australian users: This section shows your net capital gain using the ATO Q18 netting method. The CGT discount model shows: total gains (non-discount and discount-eligible separately), capital losses, the 50% CGT discount amount, and your net capital gain. Tax years display in “2024-25” fiscal year format.
Estimated Tax Liability
Section titled “Estimated Tax Liability”Below the capital gains summary, you’ll see an estimated tax liability calculated using your marginal tax rate. Click the Marginal Rate value to edit it — PrivateACB remembers it for next time.
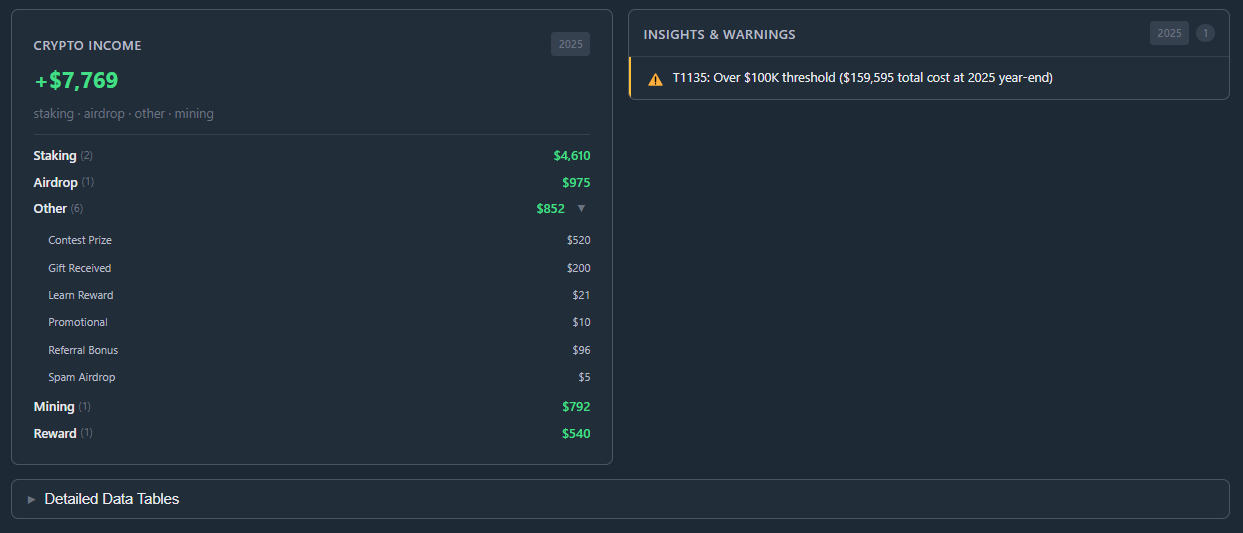
Crypto Income Card
Section titled “Crypto Income Card”Shows taxable crypto income received during the tax year:
| Income Type | Examples |
|---|---|
| Staking | Proof-of-stake rewards |
| Mining | Mining rewards |
| Airdrop | Token airdrops |
| Reward | Exchange rewards, referral bonuses |
| Interest | DeFi lending interest |
| Other | Your custom income types from Classification Review |
Income is taxed at your full marginal rate (no 50% inclusion).
Click the expand arrow to see the full breakdown of all income types, including any custom classifications you defined during import.
2. Cost Base by Asset (Treemap)
Section titled “2. Cost Base by Asset (Treemap)”The Cost Base by Asset treemap shows your portfolio’s cost basis at year-end in a visual layout.
Understanding the Treemap
Section titled “Understanding the Treemap”Each rectangle represents one asset, sized proportionally to its cost basis. Bigger rectangle = bigger holding. You’ll instantly see which assets dominate your portfolio.
Asset Details
Section titled “Asset Details”Each asset block shows:
| Detail | Description |
|---|---|
| Symbol | The asset ticker (BTC, ETH, SOL, etc.) |
| Percentage | Share of total portfolio cost basis |
| Total Cost | Your cost basis in this asset |
| Avg Cost/Coin | Your average cost per unit |
Color Coding
Section titled “Color Coding”Each asset gets its own color for quick visual identification. Colors persist between sessions — BTC will always be the same color every time you visit.
3. Pipeline Status
Section titled “3. Pipeline Status”Never wonder if your calculations are up to date! The Pipeline Status card tracks calculation readiness for each asset.
Status Indicators
Section titled “Status Indicators”Each asset displays three pipeline stages:
| Stage | Icon | Meaning |
|---|---|---|
| Data | ○/● | Transaction data imported |
| Prices | ○/● | Market prices available for all transactions |
| Calculated | ○/● | ACB/cost basis calculations complete |
- Filled circle (●): Stage complete
- Empty circle (○): Stage incomplete — action needed
Pipeline Summary
Section titled “Pipeline Summary”The header shows overall progress: “X of Y Ready” tells you exactly how many assets have completed all three stages.
Smart Actions
Section titled “Smart Actions”Click any incomplete stage to jump directly to the fix:
- Missing Data → Import wizard
- Missing Prices → Market Data tab
- Missing Calculated → ACB Calculator tab
4. Insights & Warnings
Section titled “4. Insights & Warnings”The Insights & Warnings panel gives you actionable guidance based on your actual data.
Insight Types
Section titled “Insight Types”| Icon | Type | Purpose |
|---|---|---|
| Warning | Issues requiring attention | |
| Tip | Optimization suggestions | |
| Info | Informational notices | |
| Success | Confirmation of good status |
Common Insights
Section titled “Common Insights”T1135 Foreign Property Warning (Canada)
“Foreign property cost exceeds $100,000 CAD”
If your year-end cost basis exceeds $100,000 CAD, you must file Form T1135. PrivateACB automatically monitors this threshold.
Superficial Loss Warning (Canada)
“X assets have superficial losses totaling $Y”
Some of your losses were denied under the 30-day superficial loss rule.
Wash Sale Warning (US)
“X wash sales detected totaling $Y in disallowed losses”
Losses disallowed under IRS §1091 — see the Wash Sale Guide for details.
Missing Prices Warning
“X assets missing price data for Y transactions”
Fetch market prices before finalizing your calculations. See the Market Data Guide.
Stale Calculations Warning
“X assets have Y new transactions since last calculation”
You’ve imported new data — run the calculator to update your numbers.
Taking Action
Section titled “Taking Action”Many insights include an action button (e.g., “View Report”, “Recalculate”, “Fetch Prices”) that takes you directly where you need to go.
5. Collapsible Detail Tables
Section titled “5. Collapsible Detail Tables”Below the main cards, power users can expand three collapsible tables for deeper inspection:
Import History
Section titled “Import History”Shows all import jobs with date, source, record count, and status. Useful for verifying that all your exchange data has been loaded.
Calculation Status
Section titled “Calculation Status”Shows the most recent calculation for each asset — when it was run, which method was used, and whether it’s current or stale.
Market Data Status
Section titled “Market Data Status”Shows which assets have complete market data (exchange rates and crypto prices) and which have gaps that need attention.
These tables are collapsed by default to keep the dashboard clean, but they’re always one click away when you need the details.
Best Practices
Section titled “Best Practices”- Start with the Pipeline — Ensure all assets show three filled circles before reviewing tax estimates
- Check Insights First — Address any warnings before generating reports
- Review the Treemap — Verify your cost basis distribution matches expectations
- Verify Income Types — Ensure income is categorized correctly for proper tax treatment
- Compare Tax Years — Switch between years to spot trends and catch anomalies
Related Guides
Section titled “Related Guides”- Canadian Tax Reports Guide — Schedule 3, T1135, Superficial Loss reports
- US Tax Reports Guide — Form 8949, Schedule D, Wash Sale reports
- Market Data Guide — Fetching and managing crypto prices and exchange rates
- Classification Review Guide — Custom transaction type classification
Last Updated: February 2026 PrivateACB Version: 2.0