Your watchlist. Your machine.
Your terminal.
A free desktop research dashboard. Macroeconomics, your watchlist, and one screen that shows where everything stands today versus the last five years.
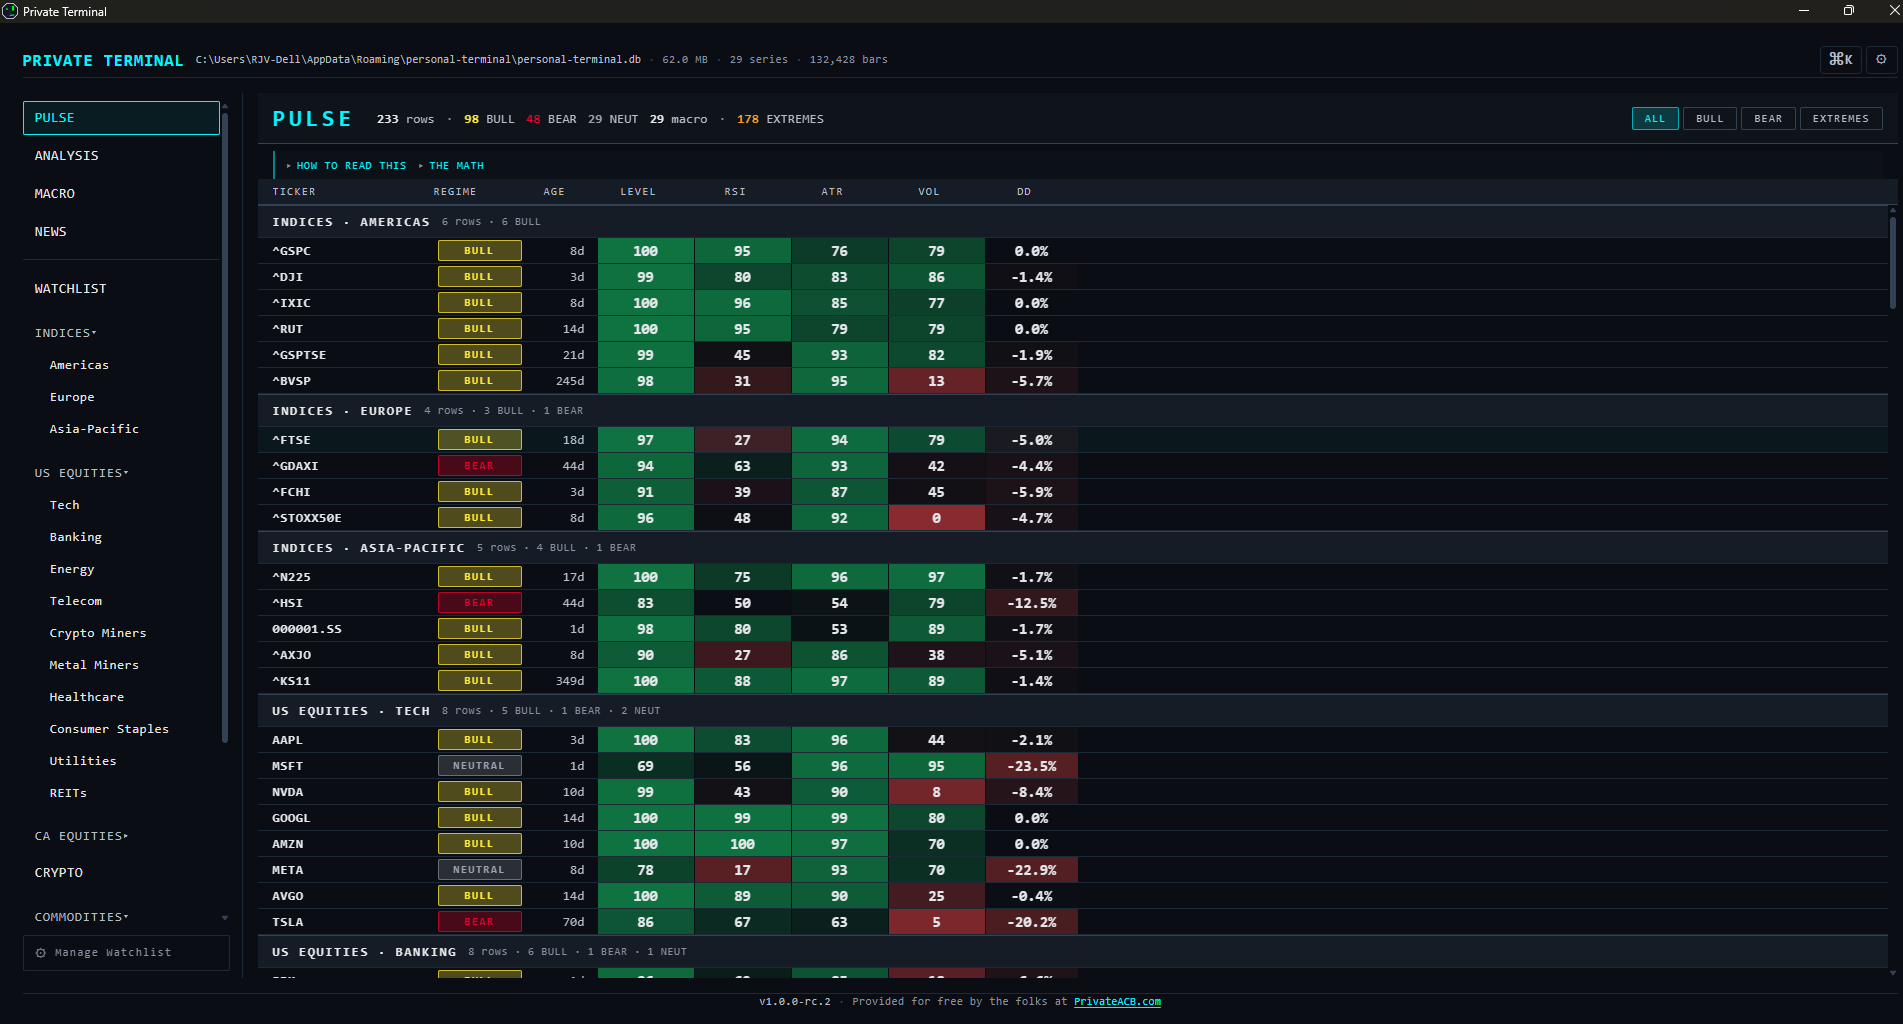
Pulse — every ticker and macro indicator expressed as percentile-rank versus its own trailing 5-year window. Sortable, filterable, click any ticker to drop into a chart.
Built because we wanted to use it.
Most retail charting tools — TradingView, KOYFIN, the brokerage screens — gate features behind accounts, sell behavioral data, or push toward an upgrade tier. We build privacy-first software for a living. We follow markets. We wanted a research dashboard that worked the way our own tools work, so we built one and gave it away.
Same team that builds PrivateACB. Same answer to the same question: your data is yours.
The chart you wished came free.
Multi-indicator candlestick view with the toolset that's subscription-tier elsewhere. Click anywhere on the price pane to anchor a VWAP. Stack up to five anchors per ticker. Anchors persist per-ticker, per-session, automatically.
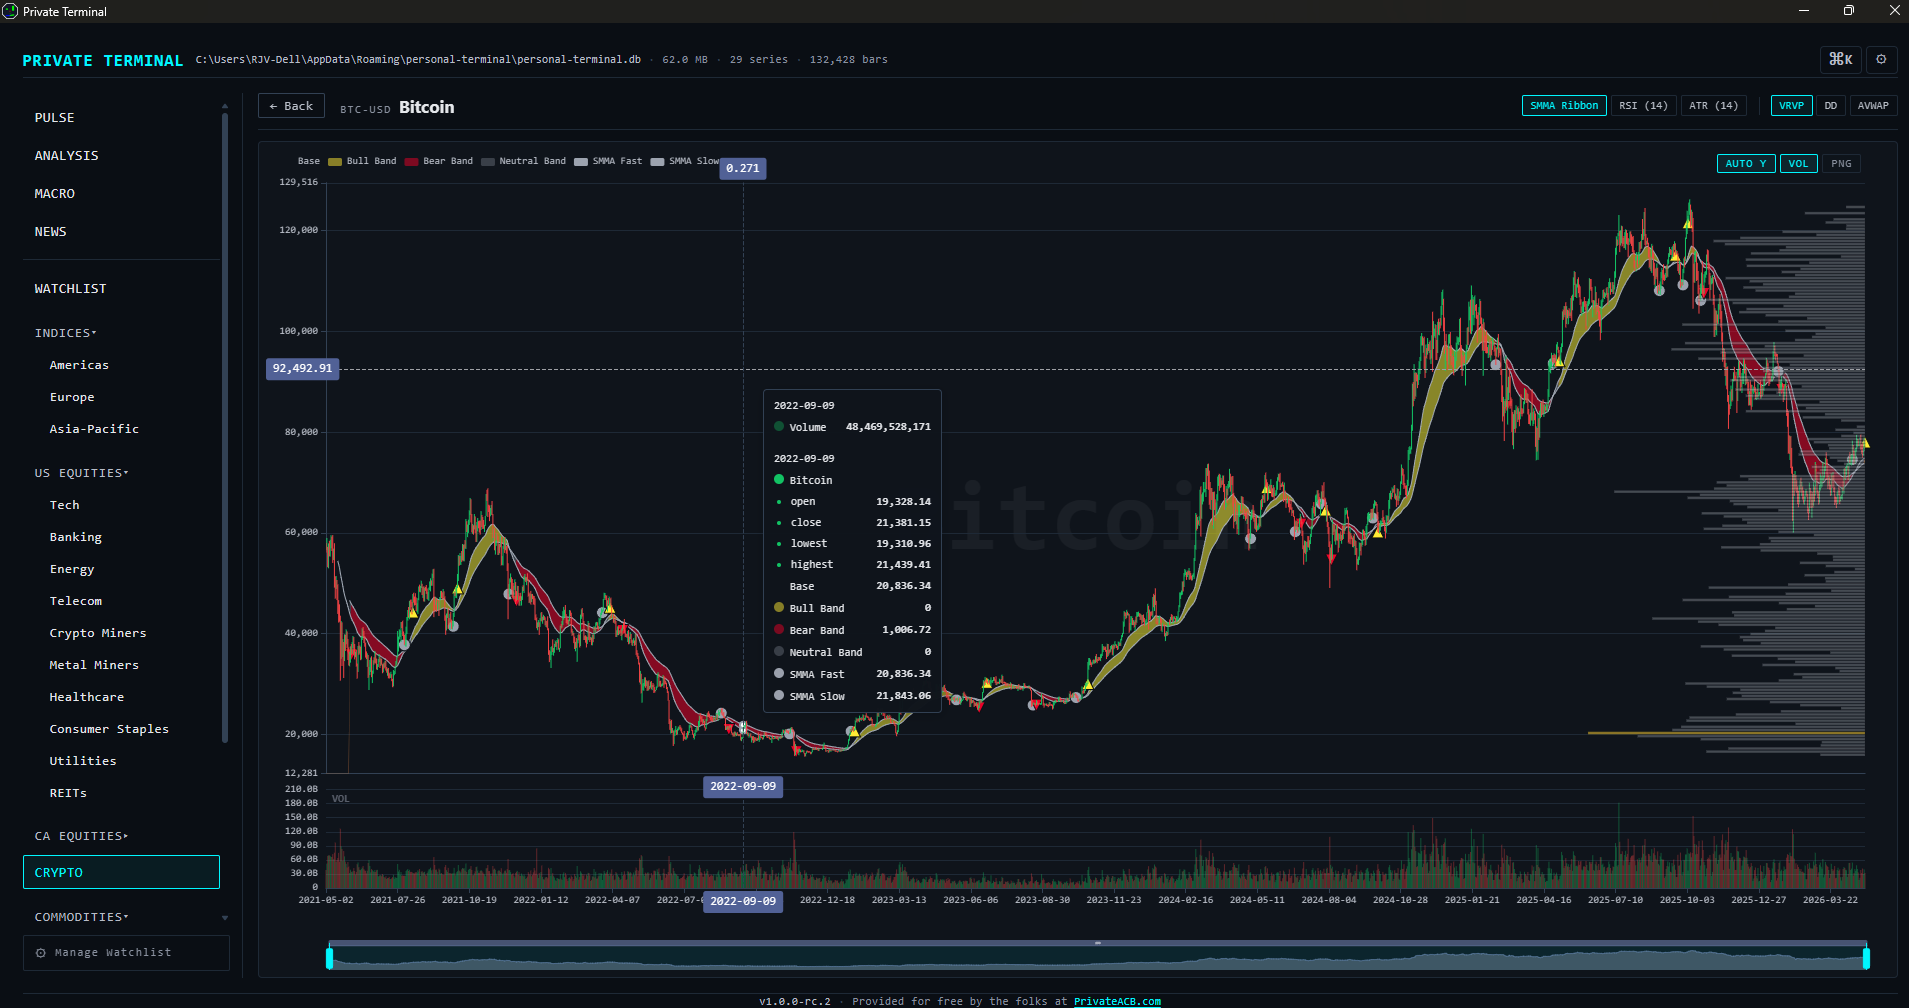
Bitcoin with SMMA Ribbon (quad-MA state classifier), Volume Profile right-side overlay, RSI, ATR, Drawdown subpane, and multi-anchor Anchored VWAP — six indicators co-rendered on shared time axis with a single dataZoom slider.
What's inside.
Pulse cross-section
Every watchlist ticker plus every macro series as percentile-rank against a 5-year baseline. The "what's actually weird this morning" view. One sortable, filterable screen.
Macro dashboard
29 FRED economic series across rates, inflation, labor, growth, housing, liquidity, risk, energy. YoY heatmap toggle. Click any tile for the full series chart.
Multi-indicator charts
SMMA Ribbon, RSI(14), ATR(14), Volume Profile, Drawdown, multi-anchor Anchored VWAP. Click-to-anchor on the price pane. State persists per ticker.
Cross-asset analysis
Seven analysis tabs — Correlations, Pairs ratios, Relative Rotation Graph, Yield Curve, Recession Probability, Financial Conditions, Macro Regime Quadrant. Each with plain-language interpretation guidance.
Curated universe
176 seed tickers across US and Canadian equities, top-10 crypto, world indices, commodities, FX, bond ETFs, VIX. Add your own. Restructure freely.
Command palette
Ctrl+K for fuzzy search across tickers, sectors, FRED series, Analysis tabs. Two keystrokes to anywhere.
Same team. Same values.
Both Private Terminal and PrivateACB answer one question the same way: your data is yours. We don't think a research tool should sell your watchlist, and we don't think a tax tool should require uploading your transaction history to a server.
- No accounts. Ever.
- No telemetry. No analytics. No phone-home.
- All data in a single SQLite file on your machine.
- No upsells inside the app.
- Full source on GitHub. MIT license.
The full list of outbound network calls — and what each is for — is documented inside the app at Settings → Privacy and in our privacy policy. There are four legitimate destinations: FRED for macroeconomic series, Yahoo Finance for quotes and history, Finnhub for US-equity news (only if you bring an API key), and the news RSS feeds you choose to enable. Nothing else.
Get it.
Windows 10/11. ~7 MB installer. No account required. The installer is free; the source is open.
First launch will trigger a Windows SmartScreen warning — the app isn't code-signed yet. Click More info → Run anyway. Code-signing is on the v1.x roadmap.
The Macro dashboard requires a free FRED API key (5-minute setup at fred.stlouisfed.org). The rest of the app works without one.
Mac and Linux builds are not currently provided. Tauri supports them; the codebase is portable; we just haven't packaged for them. PRs welcome.